
01
The audit
30 minutes, by video
Google Meet · 30 min
Where the money goes
3 hrs/day re-keying
The figures come from what has already been entered elsewhere: nothing to consolidate, nothing to re-key, and everyone sees only what concerns them.
Someone consolidates three spreadsheets for Monday's meeting. By the time they're assembled the figures are a week old — and since two departments don't count the same way, the meeting starts by arguing about the number instead of deciding.
Sites spreadsheet
Sales spreadsheet
Operations spreadsheet
Monday meeting
closed 0 days ago
Operations
Sales
two figures for the same thing
No dashboard is filled in by hand. What you see comes from the quotes, time entries, deliveries and invoices already entered elsewhere in the app: Monday's figure is Sunday night's, not last week's.
And since there's only one entry, there's only one figure: two screens can no longer disagree.
Dashboard
Margin
Workload ahead
Receivables
no extra data entry
A dashboard with thirty indicators only proves you have one. We look for the three figures that trigger a decision in your business, and we write down the exact rule that computes them — so they stop being arguable in meetings.
Once the app is live, we come back to what it actually saved, using your figures. That's what justifies the subscription, or ends it.
3 of 30
Margin per job
rule written down
Workload ahead
rule written down
Receivables
rule written down
Four steps, and a figure before we talk price.
01
30 minutes, by video
Where the money goes
02
on your own data
03
a fixed price, in writing
04
delivered in pieces
50 %
then the subscription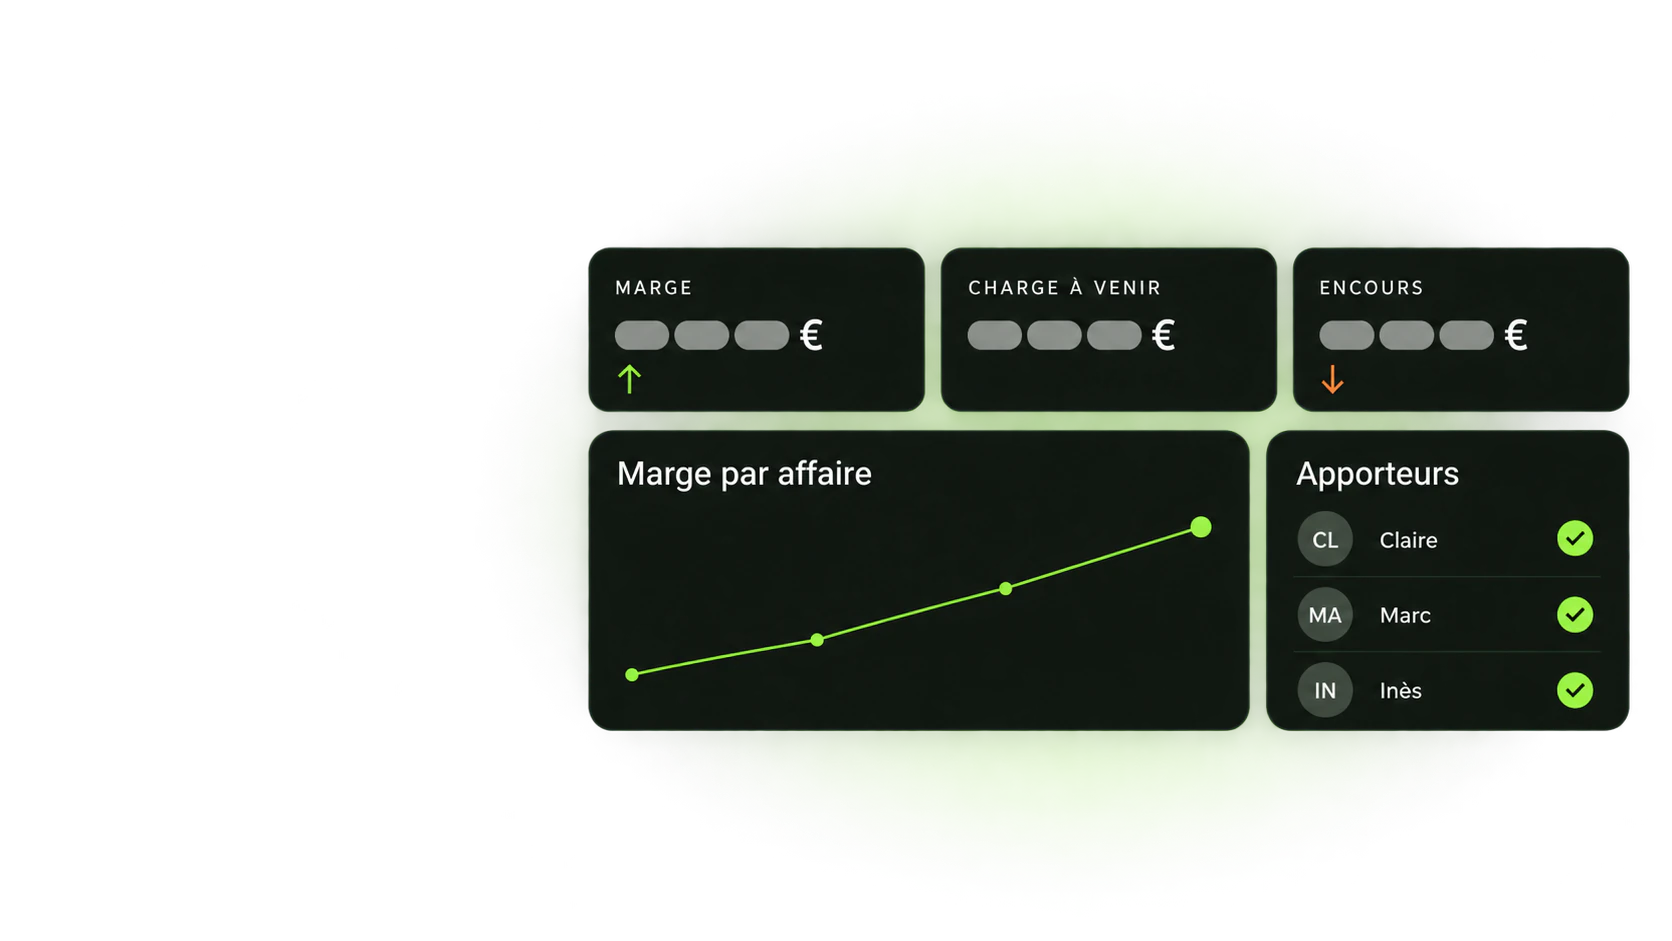
Their words, exactly as they wrote them to us.
Communication was fast and effective throughout the project. They analyzed our needs perfectly and met them 100%, if not more — genuinely high standard, while staying true to the offer. Timelines were excellent. What really struck us was their expertise: they guided us and explained their choices clearly, bringing real know-how about what converts. Serious, responsive and expert — I recommend them without hesitation!

Steve Bron
Co-founder, Buckmoon Agency
The Edenio team was incredibly committed from the start. They understood our brand world, our tone and our technical constraints. The design is modern, clear and true to who we are. Communication was always smooth, deadlines were met, and their strategic advice on user experience had a real impact on our conversions.

Jeremy Boissinot
CEO, Favikon
The team did a fabulous job. Their support from start to finish, their professionalism, commitment and recommendations mean I'll be working with them again! I've finally found my go-to agency! I highly recommend them — you can go in with your eyes closed.

Maxime Dohollo
CEO, Agence Nuisibles
We worked together for several months and I'm fully satisfied with what was delivered. He quickly grasped how complex and varied our offer is, and put in place a clear, smooth, well-thought-out process.

Alexandre Velardocchio
Co-founder and CEO, Gust
Here are the first three qualities that come to mind: professionalism, integrity, efficiency. Thank you for our exchanges and for the work delivered. I recommend them.

Fabien Nahum
Head of Sales, Opsima
And if yours isn't here, ask us directly.
From what has already been entered elsewhere in the app: quotes, time records, closeouts, invoices. Nothing is re-keyed for the dashboard, so nothing can diverge between two screens.
Whatever you decide. A team lead sees their own jobs, a director sees margin, a client sees their own file and nothing else. Access is set by role, and changed without us.
Yes, and that is not an admission of failure: a spreadsheet is still the fastest tool for an analysis you will only run once. What changes is that the export starts from a single figure instead of building it.
Every deal carries its referral partner. What they brought in, what signed and what they are owed work themselves out, instead of being pieced together from memory at quarter end.
No, and for most companies this size the question doesn't arise: a BI tool needs someone to keep it alive. Here the figures exist because the work was recorded, not because an analyst prepared them.
Let's talk
We look at how you work, and give you the number that goes with it.
No commitment · You pick the time



 Jérôme Knops
